¶ Info toolbar - 2D Window
The info toolbar has no tools to run; as the name suggests, it shows the user information about the cursor's current location and the number of points loaded. It is located at the bottom of the view.
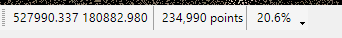
The first two numbers show the cursor's current location. The following number is the current number of visualised points in the 2D view, and the last % is the % of the loaded points from the total number of points in this area. As described in the 2D view article, the 2D view dynamically adjusts the number of points visualised in 2D according to the scale factor.
If the user clicks on the coordinates, the jump to XY panel will appear, where the user can specify the XY coordinates manually, and the 2D view will jump to the selected coordinates using the same zoom level.
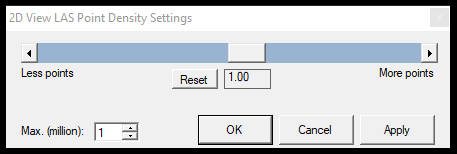
If the user clicks on the point number or %, the 2D view LAS point density settings window will be opened. In this window, the user can adjust how many points shall be visualized in the 2D view. This function is currently in the refurbishment phase, meaning the user cannot change the settings (or the adjustment won't affect the view).